Relative ATR (Average True Range) Indicator for cTrader
The Relative ATR Indicator for cTrader is a powerful tool designed to gauge volatility in relation to a longer-term average volatility. It's built to assist traders in understanding how current volatility compares to historical volatility, providing valuable insight for potential trade entries, exits, and risk management. It is also usefull for systematic traders to use on cBots working different symbols, as the values of the Relative ATR are usually more easily understood
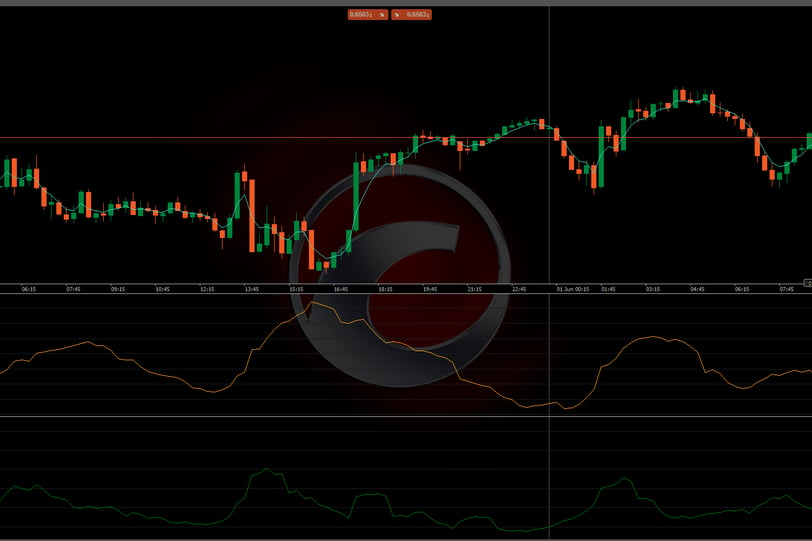
As you see in the picture, the upper indicator panel shows the Average True Range, the lower panel shows the Relative Average True Range. It is a lot easier to understand the relative ATR as values above 1 implies that the short term volatility is higher than the long term volatility.
This custom indicator takes two parameters, a "fast" and a "slow" period. By default, the fast ATR period is set to 5 and the slow ATR period is set to 50. I found these values to be best for intraday trading.
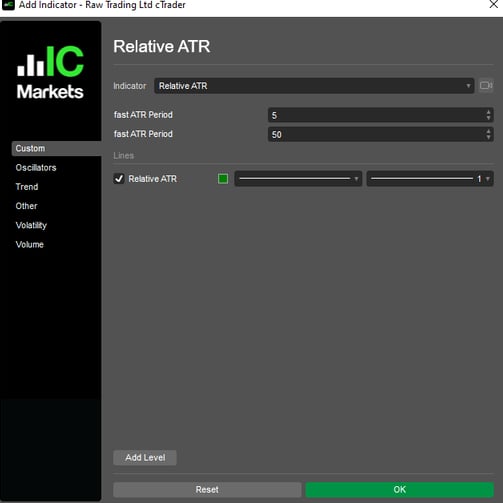
These two periods represent the time periods over which the ATR is calculated. The "fast" ATR is more sensitive to recent price changes, while the "slow" ATR smooths out these changes over a longer period. By comparing these two values, the Relative ATR Indicator can give an indication of whether recent price movements represent a significant change in volatility.
The main calculation occurs in the `Calculate` method, which is called for each new price data point. The Relative ATR is calculated as the ratio of the fast ATR to the slow ATR. This ratio is then outputted as the indicator's result, providing a real-time measure of relative volatility.
Remember: As with any indicator, the Relative ATR should not be used in isolation, but in conjunction with other indicators and analysis methods to make informed trading decisions.
In Summary, I found the relative average true range to be a better way to objectify volatility than the average true range.