Trading rules for divergence include entering a short position when the divergence is identified and the market has corrected or an objective has been reached. Additionally, it's essential to exit the short position when the current momentum moves above the last momentum peak, indicating that the divergence has disappeared.
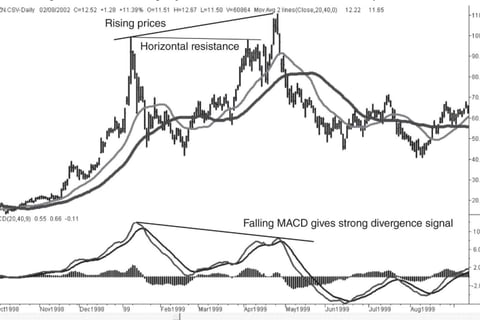
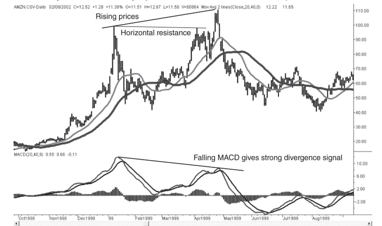
Anticipating divergence is another approach that can lead to more successful trading. By recognizing the potential for divergence as prices move above their previous resistance level, traders can enter a short position as long as the current momentum value is below the last peak momentum value. This method allows for profiting from the entire downward reversal, albeit with higher risk.
In some cases, traders may encounter double and triple bearish divergences, which are more reliable than single divergences and represent a prolonged period of slowing price increases. These patterns can be automated using various programming techniques, although it's important to understand that there are many choices to be made in recognizing divergence patterns.
In conclusion, understanding momentum divergence can be a valuable tool for traders looking to capitalize on potential market trend reversals. By mastering the concepts and strategies outlined in this blog post, you can enhance your trading skills and increase your chances of success in the market.
In summary, momentum indicators and oscillators are valuable tools in technical analysis, providing insights into the strength and direction of price movements. They can help identify potential trend reversals and optimal entry points by analyzing price and momentum divergences. However, they must be used with caution, as they can be highly unstable when calculated over short time intervals and may generate frequent false signals.
A few key points to remember when using momentum indicators include:
1. Adjusting the calculation period: If the indicator gets stuck at the top or bottom value, the calculation period is too short; if it does not reach the top or bottom value, the period is too long.
2. Anticipating the indicator's turn: Acting before the indicator turns is often more beneficial than waiting for it to turn.
3. Using oscillators in trending markets: Momentum indicators tend to stay at the top or bottom of the range in trending markets, so it is essential to take this into consideration when analyzing signals.
4. Incorporating momentum indicators into a larger strategy: Momentum indicators are often most effective when used as a timing tool within a broader, long-term strategy, such as a macrotrend. In this case, it is crucial to tune the calculation period to allow momentum values to reach extremes with a frequency that provides better entry points.
By understanding the nuances of momentum indicators and oscillators and applying them wisely in conjunction with other technical analysis tools, traders can improve their market timing and enhance their overall trading performance.